押出データ解析
EDA
RCDIGITAL,Inc.
May 2019
1
押出データ解析
1-1特長
アルミ押出工場をIT化します。
等速押出と等温押出(RcdWin)、押出管理(EM)、押出データ解析(EDA)がデータベースに保存したデータを利用して、以下のような機能があります。
-
押出データの帳票とグラフ化。
-
設備の異常データの検出。
-
アルミ押出機の停止時間(アイドルタイム)と少しの停止(チョコ停)と押出ダイス交換時間のCSVファイル化。
-
押出パラメータの押出ダイスごとの履歴(押出速度など)。
-
押出ダイス使用履歴。
-
リアルタイムモニタ。
-
歩留り。
1-2
メンテナンスと拡張性
RcdWinパソコンはLAN上で稼働するので、工場の生産管理システムと連携して、押出の自動化ができます。
押出パラメータを自動的に収集して、押出パラメータを自動で調整します。
押出データ解析プログラム(EDA)にデータを送信して、EDAで押出データの解析が行えます。
メンテナンスは、インターネットを通してリモートで行います。
RcdWin,EDA,EM,EP,RcdWinMoniと押出データベースは、1つのパソコンで動作します。
↑TOP of Page
2
押出ダイス選択画面
[押出ダイス番号]を選択して、[押出ダイス使用履歴]クリックします。
-
[押出ダイス使用履歴]画面に遷移します。
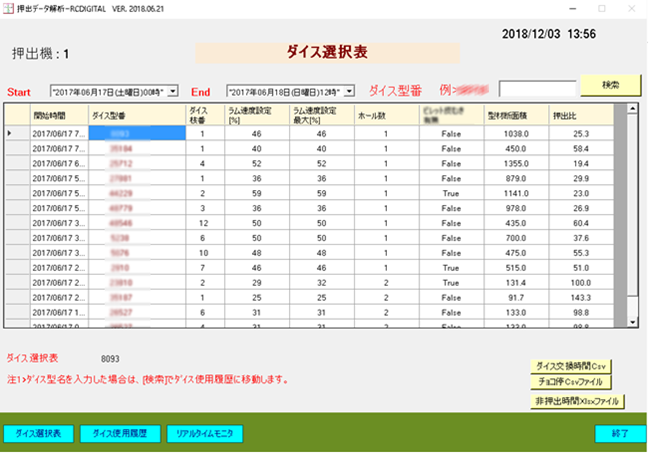
図番2-1 押出ダイス選択画面
-
[非押出時間Xlsxファイル]をクリックします。
-
押出のEndから押出のStartまでのアイドル時間が、グラフでXlsxファイルに出力されます。
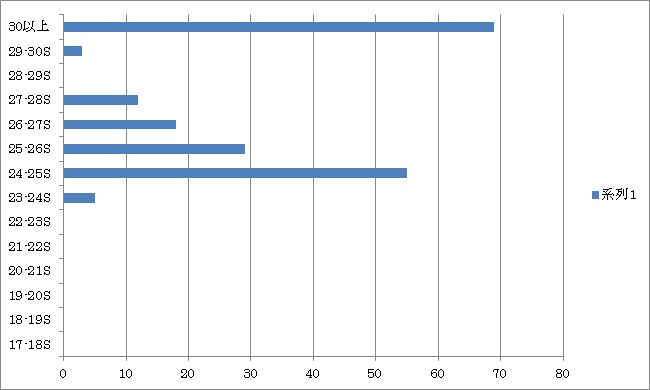
図番2-2 非押出時間(押出機アイドルタイム)Xlsxファイル
↑TOP of Page
3
押出ダイス使用履歴
-
押出ダイスの使用履歴を新しいものから順番に表示します。
-
選択した日の押出ダイスの押出パラメータを下段の表に表示します。
-
[押出ビレット表]を実行すると、選択した日の押出ダイスの帳票印刷画面に遷移します
0
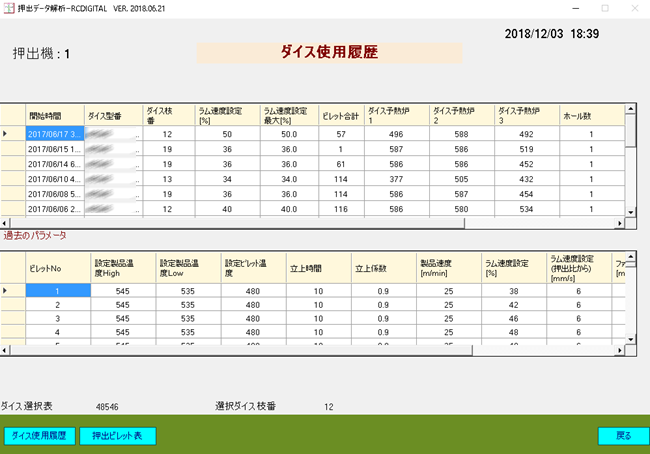
図番3-1 押出ダイス使用履歴
↑TOP of Page
4
押出ビレット表
-
[印刷]ボタンの実行で、プリンタ、Excel,PDF,Wordに帳票を印刷できます。
-
[グラフ]ボタンの実行で、押出過程をグラフで見ることができます。
-
下段の表で計測データの異常値の設定ができます。上段は異常値以上で、下段は異常値以下です。異常値には、帳票の数値の値の前に**が付きます。
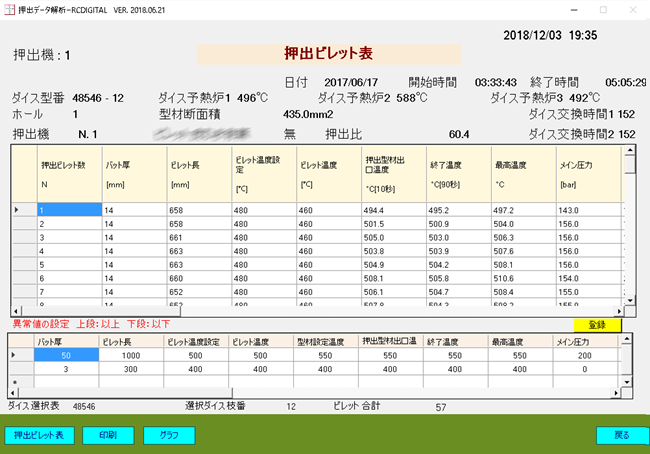
図番4-1 押出ビレットテーブル
4-1
押出ビレット一覧表の例
-
帳票の表示する項目は、工場によって異なりますが、印刷する帳票は、A4横で3ページぐらいになります。
-
エクセルの場合は、ファイルで開くと、行の全体が1行で見ることができます。
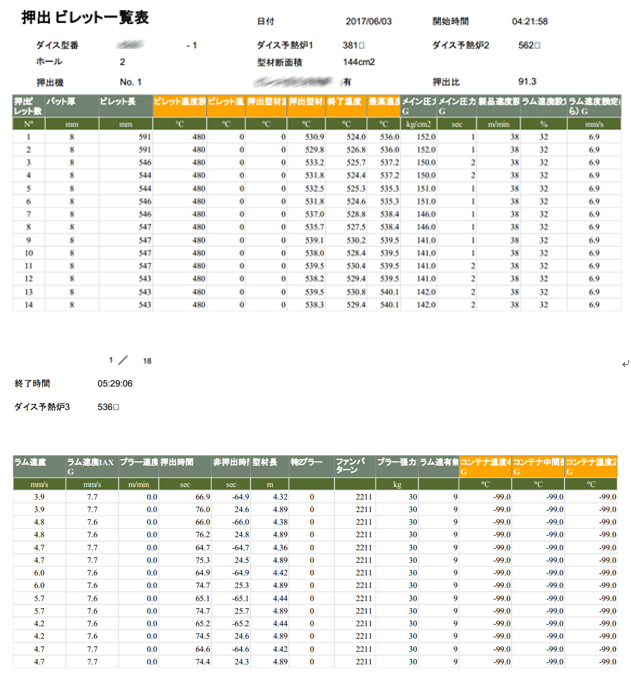
図番4-2 押出ビレット一覧表
↑TOP of Page
5
押出データ検索
lblEdaS5003
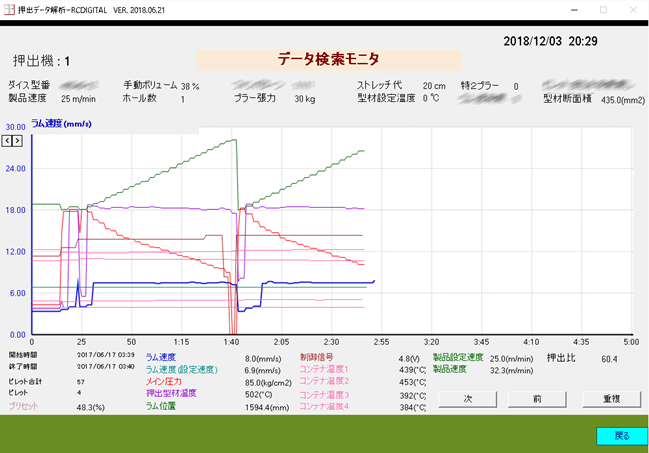
図番5-1 押出データ検索
↑TOP of Page
6
リアルタイムモニタ
-
押出状況をリアルタイムのグラフで見ることができます。
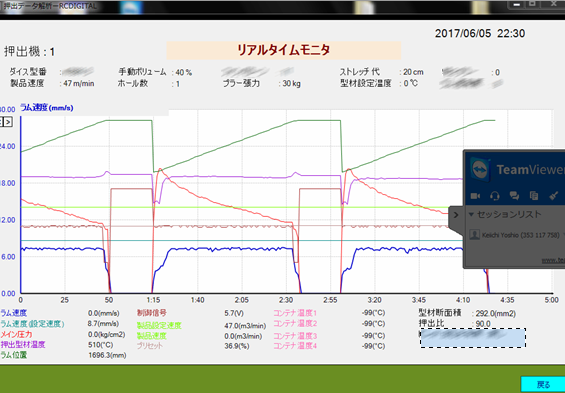
図番6`-1 リアルタイムモニタ
↑TOP of Page
7
製品の歩留り
-
押出ダイスのロット単位の良品個数を参照して、指定した期間の歩留まりを計算します。
-
同じ押出ダイスが2回でてきた場合は、2回目のダイスの良品個数は累計になります。
-
終了メッセージがNoの場合は、まだ良品個数が入力されていません。
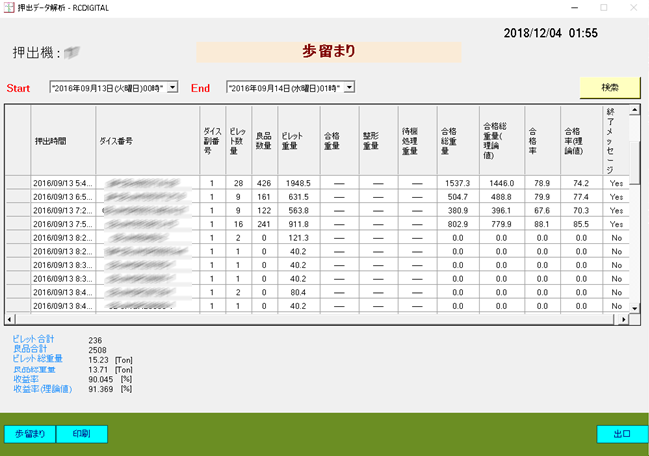
図番7-1 Product yield
↑TOP of Page